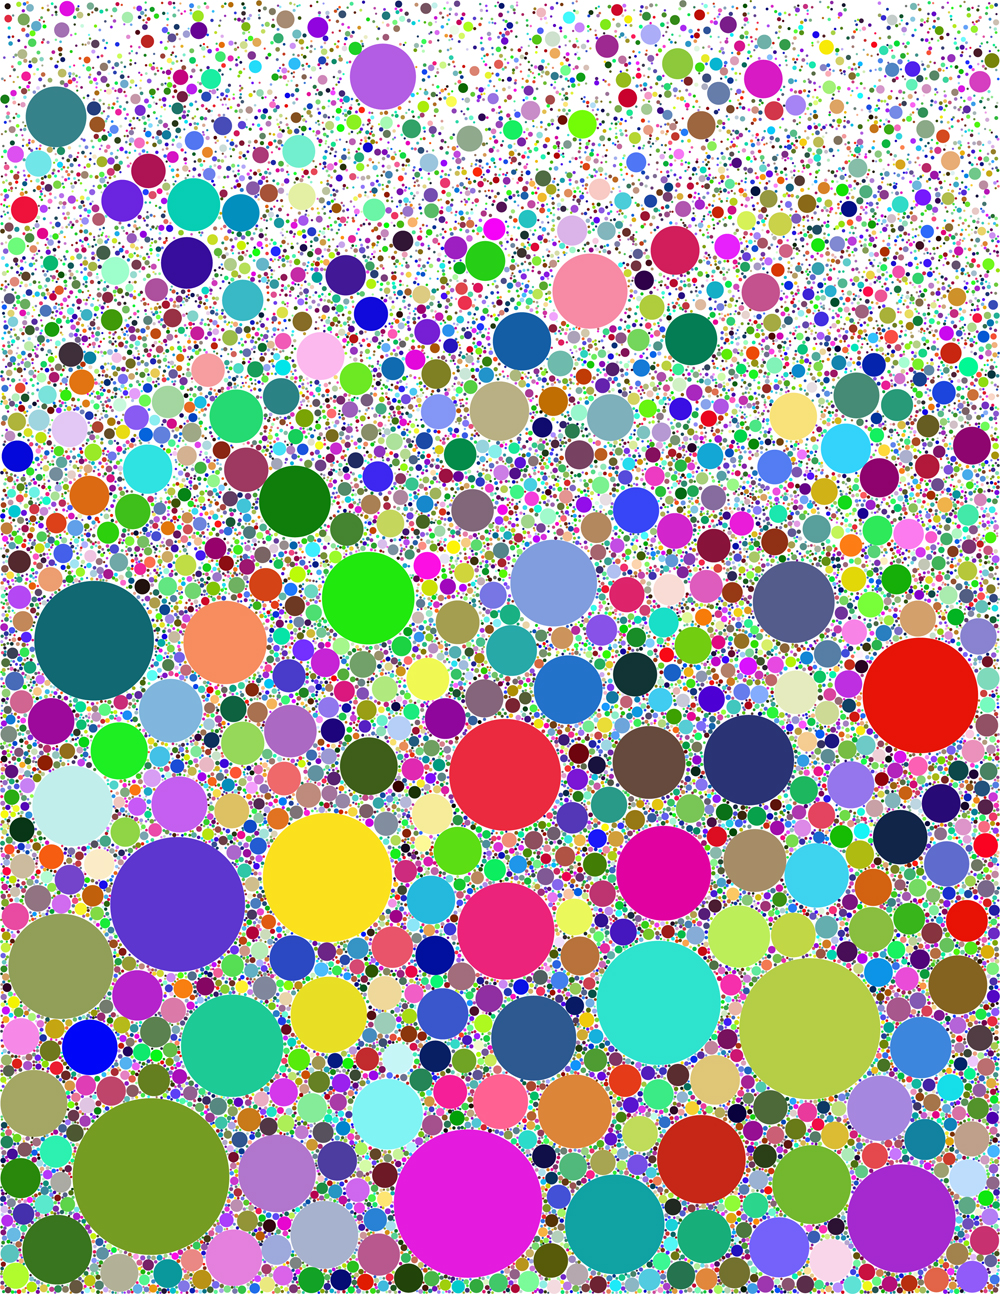
In most of the examples shown here the probability distribution is constant within the x-y plane. This results in an image where the fill factor and size of shape are about the same everywhere. Does it need to be this way? In fact it does not. The image below (random color) has most of the largest circles near the bottom and becomes rather sparse near the top. It has a nonuniform probability distribution. Scroll down below the picture for more on this.
The probability distribution decays exponentially upward with the y coordinate here. y values near the bottom of the image are much more probable than near the top. This results in a vertical gradient of both circle size and fill factor.
The effect of this is to place the largest features near the bottom, and to have a higher fill there. Success in this requires some understanding of how the algorithm works. In particular it will be necessary to go to a smaller c value, i.e., make the equivalent uniform image rather sparse. Otherwise the operation of the algorithm will fill up the bottom region completely and the process will slow down to a snail's pace.
How do you actually implement this? Ordinarily one chooses random x and y with a flat distribution, and this continues to be done. What is new is that the x,y are subjected to a further probability test before any test of overlap with previous shapes is made. If rand is a random number from 0 to 1, and p(x,y)=exp(-a*y) (a is a parameter) is the probability, then one only does the overlap test if rand<p(x,y). This concentrates the trials in the low-y region. Quite a few trials are "wasted", but the algorithm doesn't slow down much because the rejected x,y aren't used in an overlap test.
The probability function p(x,y) can have an immense variety of forms, resulting in different images. Many other variations along these lines are no doubt possible.
John